|
MHCBENCH TUTORIAL
The following section describes the use of MHCBench with an example. Please do what is
instructed. However, we have tried to make it as user friendly as possible, but may
have missed some important points. Please send us your valuable comments
Getting the input in correct format
The MHCBench server requires data in a simple but specific format. Before proceeding with evaluation decide whether you want threshold dependent or threshold independent evaluation and choose the appropriate link. For the evluation you are required to submit the input data. There are two options for input. Either you can directly submit the input from a file or you can use the CUT/PASTE option.
For example, try the following files.
Example data 1
Example data 2
- Either download these files and submit as a file input
- Or click on the above links and use the cut and paste option
Completing the data submission
It is very simple. The Thresahold independent evaluation require only the input data, so you have to just click on the evaluate button.
The threshold dependent evaluation requires one additional selection. Since it is threshold dependent you have to select form a list of pre-selected threshold values. You may choose all, but at least one is necessory. A brief description is as follows
- Maximum Correlation Coefficient The evaluation parameters at a thershold where the correlation coefficient is highest are displayed. At this threshold the user will have the optimized results.
- High CoverageHigher coverage means the threshold at which 90% of binders are predicted as binders. At this threshold the user can have the confidence that there will be hardly any binder that will be missed by the method.
- Maximum DFactor [Sensitivity+Specificity] Generaly when the data set is unbalanced that is conatin unequal number of binders and non-binders, the single valued parameters (e.g. accuracy) will show bias. To give equal weightage for both this parameter take into account the sum of the percent senstivity and specificity. At this threshold the user will have the optimized results.
- Maximum Accuracy: The evaluation parameters at a threshold where the percent of correctly predicted peptides is highest. At this threshold the user will have the optimized results.
- High PPV: Higher PPV means the threshold at which there is 90% probability that a predicted binder will actually be a binder. At this threshold the user can have the confidence that what ever the method predicts, there is good chance that it will be a binder.
- Sensitivity =~Specificity: Many a times when the optimised threshold is unknown the threshold at which senstivity and specificity are almost equal is selected as the optimised threshold. Hence this is threshold where both are almost equal.
- At 0.5 threhold: It means halfway in the prediction range. Because the predicted results can vary between 0 and 1.0 so the evaluation at 0.5 threshold some times provide useful information about prediction methods.
If you have choosen the Threshold Independent Evaluation, you will see the following results.

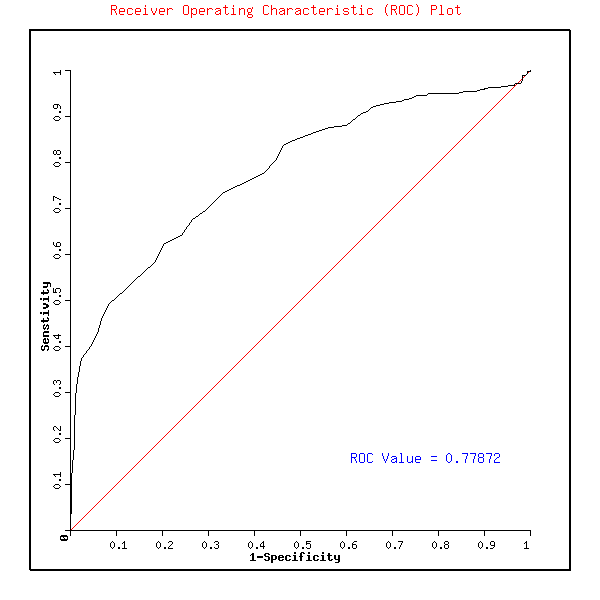
The numerical value is the represenattion of the predictive potential of the method that is the ROC. Click on the button to see the ROC plot. The ROC plot represents the predictive potential of algorithm at different thresholds. The ROC plot with this example data is shown below.

If you have choosen the Threshold Dependent Evaluation, you will see the following results. For each selected thershold parameter a seperate table is generated.

Each of this value is clickable and you can have information about how they are caculated, what is the significance etc.
WE HOPE YOU WILL FIND THE TUTORIAL INFORMATIVE & INTERESTING
|