ALGORITHM AND PARAMETERS
ALGORITHM:
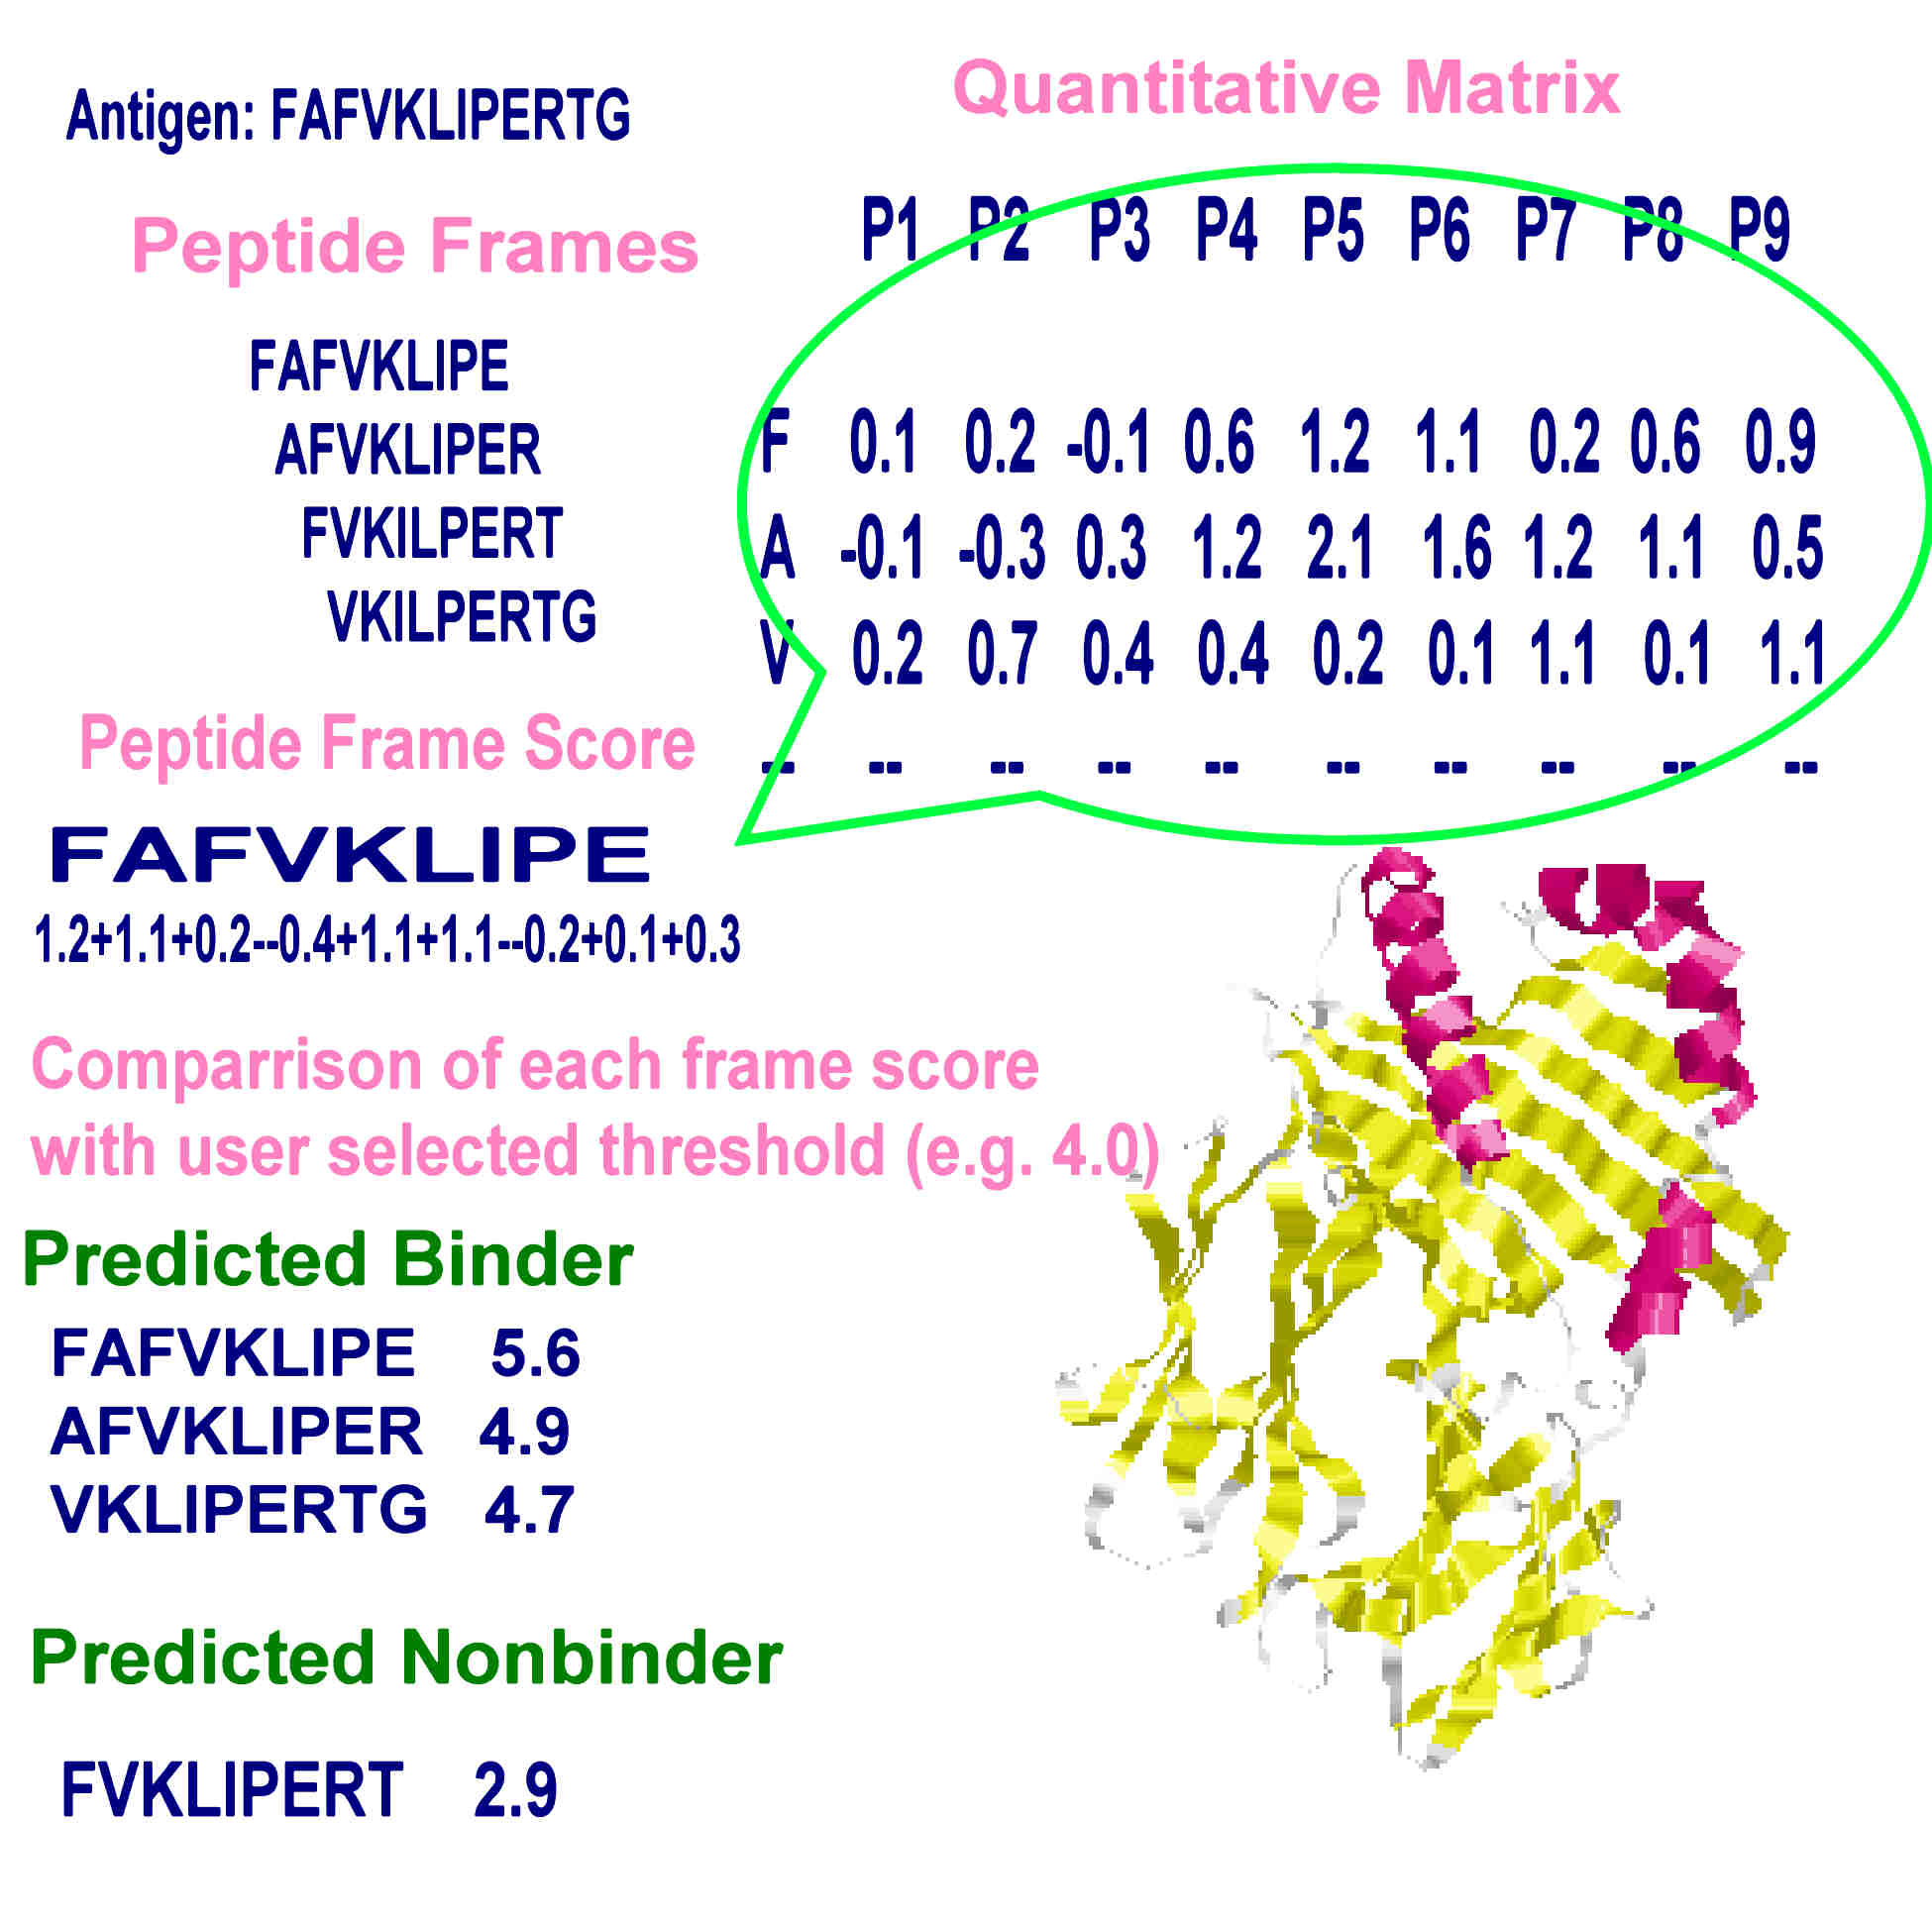
The server uses virtual matrices extracted from pocket profile database reported in literature by Sturniolo et al., 1999 in a quantitative matrix based prediction model. The only parameters describing peptide binding are the amino acid side chains in peptide frame. Analysis of protein is performed in following steps.
- First,
all possible nanomeric peptide frames are extracted from the input protein
sequence.
e.g. A sequence " KHGTRDFEPLM" would give
KHGTRDFEP
HGTRDFEPL
GTRDFEPLM
as overlapping nanomeric peptide frames. - Second, the position and side chain specific values, derived from virtual matrices are assigned to each residue within a peptide frame.
- Third, the linear combinations i.e. summation of all the position and side chain specific values result in a numerical value, or peptide frame score for each peptide frame.
- Finally the calculated peptide score is compared with user selected threshold value and the results are indicated in graphical as well as HTML format.
PRINCIPLE OF QUANTITATIVE MATRIX BASED PREDICTION METHODS
The peptide frame score has been shown to correlate with the binding affinity of HLA-DR ligands (Sturniolo et al., 1999), thus representing a measure for the likelihood of a peptide containing a given peptide frame to bind to HLA-II molecules. The graphical display allowed by server expresses this binding propensity effectively.
PARAMETERS:
The following parameters allow users to perform a customizable MHC Class-II binding peptide prediction.
- Name of Antigen: The field is optional but will help you in keeping a record of prediction results.
- Paste your sequence below : The user has to paste "The antigenic protein sequence" in this window. As the server uses ReadSeq. program to read the input sequence, it can accepts, in addition to plain single letter amino acids, most commenly used standard sequence formats e.g. FASTA, EMBL, PIR etc.
- Or submit from file: The user can also upload the antigen sequence directly from a file.
NOTE : Care should be taken that the server accepts input from either of two options, not both.
- Input sequence format: Both formatted and non-formated sequences are accepted as input. Depending on your input you have select the option.
- Threshold: A parameter that needs to be selected by the user is the % threshold. The threshold is defined as the 'percentage of best scoring natural peptides'. For example, a threshold of 1% would predict peptides in any given protein sequence which belong to the 1% best scoring natural peptides. The threshold values were calculated as follows:
(i) For 25 alleles the threshold values were defined in TEPITOPE software so that were used as such.
(ii) For rest 26 alleles, peptide score of all valid peptide frames in a representative database SWISSPROT with 89283 entries of natural protein sequences, were calculated.
(iii) The peptide frames were sorted according to the scores, and the score corresponding to the 1%, 2%, 3%, etc. of best scoring peptides was determined. Thus, the threshold correlates with the peptide score value and is therefore an indicator for the likelihood that the predicted peptides are capable of binding to a given HLA molecule.
The % threshold parameter allows the user to select for different stringency levels, in order to modulate the prediction results: a lower threshold corresponds to a high stringency prediction, i.e. to a lower rate of false positives and to a higher rate of false negatives. In contrast, a higher threshold value (low stringency) corresponds to a higher rate of false positives and a lower rate of false negatives. In short, from the same protein sequence input, a threshold setting of 1% will predict a lower number of peptide sequences and for a lower number of HLA-II alleles, compared to 2% or higher thresholds; however, this will also ensure a higher likelihood of positive downstream experimental results. Normally, at least for a first round of screening, threshold values higher than 3% are not desirable, since the rate of false positives can increase the size of the predicted repertoire to an amount unacceptable for later experimental testing.
- Display top scorer : Value in this field represent the number of top scorers in query antigen, to be displayed in tabular format. The peptide score of each nanomer in an antigen is calculated using quantitative matrices. The higher the score of any peptide frame the greater is the probability of it's binding to given MHC molecule. Default value is 5 % of the total number of nanomeric frames in query antigen.
- Allele:tThe user can select single/multiple allele form a list of 51 HLA-Dr alleles. HAL-DR locus covers more than 90% of MHC Class II molecules expressed on Antigen Presenting Cells. The user can select single or multiple alleles. Multiple allele option is helpful in locating promiscuous binding regions
- Result Display Format: The server offers users different result display formats to ease the identification of promiscuous binders. The peptide ligands are predicted independently for each HLA allele for easy and fast location of promiscuous or allele specific binders.
- HTML view I: Predicted binders are displayed as region underlined with " * " . This display is handy in locating overlapping binding regions in terms of their extend of overlap.
- HTML view II: Predicted binders are displayed as blue colored region, with P1 anchor or the starting residue of each predicted binding frame as red colored. This display is useful in locating promiscuous binding regions.
In addition to these the server offers another option for results i.e. the Sorted Top Scorer where the Peptide frames are sorted according to their score and the user selected number of highest scoring peptide frames with their location , score and other information are displayed. This display option can be clicked from the bottom of prediction results. This is commonly used by other servers of this category.
- Graphical View : The graphical view plot , the score distribution profile, the threshold profile and best scoring subsequence profile . The score distribution profile can provide the magnitude of binding affinity helpful in selecting promiscuous binders. The threshold profile is plotted on the right side score distribution profile. Rather than getting it separately for each allele ( as done by TEPITOPE) the server plots these profiles on same window. The threshold profile that is plotted on a meaningful scale of percent threshold vs number peptide frames, is helpful in selecting appropriate threshold for locating promiscuous binding regions. The third profile that is the best scoring subsequence profile is plotted only during subsequence analysis. It is similar to threshold profile, but here only the highest scoring peptide frame is used for calculations. The plot is same as used by TEPITOPE and helpful in selecting threshold for locating promiscuous binding regions.